Your dashboard
Reading the Tellus dashboard: the four summary cards, the framework progress list, and the risk distribution panel — with the exact formulas behind each figure.
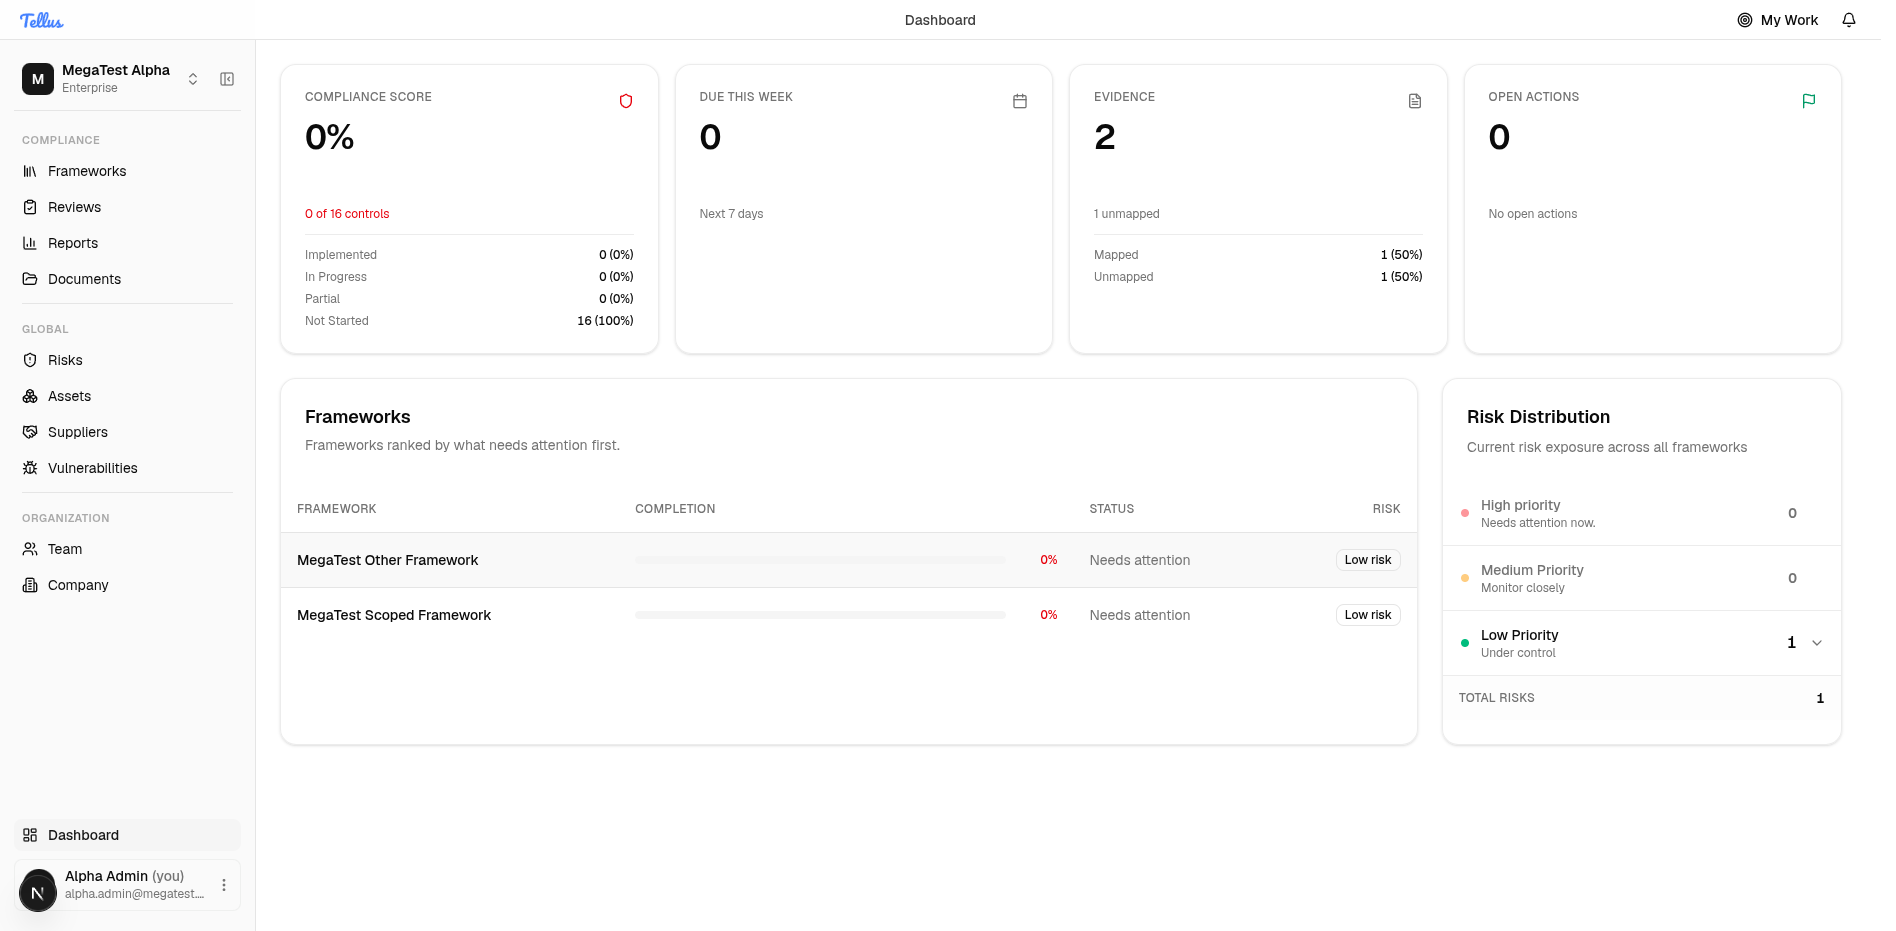
The Dashboard is the company overview at /. It is your home base if you have company-level read access; colleagues without it are sent to Frameworks instead and never see this screen. The page has three parts: four summary cards across the top, a Frameworks progress list, and a Risk Distribution panel.
Everything on the dashboard comes from a single company overview that is cached server-side for up to 60 seconds. Figures can lag a recent edit by about a minute — refresh after that window if a number looks stale.
Two filtering rules apply to the whole dashboard, so it is worth stating them once:
- Risks with status
ai_proposedare excluded everywhere — from risk counts, the average score, and all action totals. A risk can exist and still not appear here until it has moved past the AI-proposed stage. - Action figures are risk-treatment actions, reached through the chain control → risk → action. They are not the same as your My Work items or incident tasks, which come from a different place.
The four summary cards
Compliance Score
The headline percentage of how complete your controls are. It is computed as:
round( (implemented + 0.5 × partial) / total controls × 100 )So implemented controls earn full credit, partial controls earn half credit, and in_progress and not_started count as zero. The card detail rows break down how many controls sit in each of the four states — Implemented, In Progress, Partial, Not Started — and their share of the total. The card's colour is good at 80% or above, a warning from 60%, and critical below that.
The Compliance Score and a framework's own Completion percentage use different formulas and will legitimately differ. The card gives partial controls half credit; a framework's completion counts only implemented / total with no partial credit.
Due This Week
The number of treatment actions due in the next 7 days — actions whose deadline falls between now and now + 7 days and whose status is not completed, summed across all your frameworks. The card turns to a warning tone once the count exceeds 5.
Documents (Evidence)
The total number of documents for your company, with a subtitle reporting how many are unmapped. Only root evidence rows are counted (versions of a document are not counted separately). A document is mapped if it has at least one direct control mapping or at least one requirement mapping; unmapped is simply the total minus the mapped count. The card is a warning when more than 5 documents are unmapped, neutral when a few are, and good when everything is mapped. See Documents for how mapping works.
Open Actions
The total number of treatment actions across all non-ai_proposed risks. The subtitle shows the overdue count when there is one — an action is overdue if its deadline is in the past and its status is not completed. The card is critical if anything is overdue, good if there are no actions at all, and otherwise neutral. The detail rows split the total into overdue, due this week, and on track (everything else).
Framework Progress
Below the cards, each framework appears as a row with a completion bar, a status label, and a risk badge. Clicking a row opens that framework.
- Completion is the framework figure,
round(implemented / total × 100)— no partial credit (this is why it can differ from the Compliance Score card above). - Status label is derived from completion: On Track at 80% or above, In Progress at 50% or above, otherwise Needs Attention.
- Risk badge shows the highest band present among that framework's risks: High if any high-level risk exists, otherwise Medium, otherwise Low.
If you have no frameworks yet, this area reads No frameworks configured yet. See Frameworks to set one up.
Risk Distribution
The right-hand panel groups your company-wide risks into High, Medium, and Low priority by their risk level, with a count for each band and a total. Expand any band to list the individual risks inside it — each shows its title, score, and status, and links to the risk's detail page.
Risks that are linked across more than one framework are counted once for the company-wide totals (de-duplicated by risk). As noted above, ai_proposed risks are excluded. With no risks, the panel reads No risks identified. See Risks for the full register and how scores are assigned.
Returning to the dashboard
You can come back to this screen any time by clicking Dashboard at the bottom of the sidebar. That entry is hidden for users without company-level read access, since the dashboard is not their home. Read more in Finding your way around.