The risk register
The company-wide risk register: the table, its filters, the exposure matrix, and how impact x likelihood scoring works.
The Risks area is your company-wide risk register. Every risk is tracked, scored, owned, and reviewed in one place. Each risk carries an impact x likelihood score that places it on a colour-coded exposure matrix, and from a risk's detail page you assign owners, schedule recurring reviews, and link the controls, suppliers, incidents, assets, and vulnerabilities it relates to.
This page covers the register itself: what populates it, how to filter and read it, and exactly how scoring and levels are computed. The other pages in this section cover the day-to-day work:
Creating & re-scoring risks
The new-risk form, its defaults, and re-scoring a risk on the 5x5 evaluation grid.
Mitigation & reviews
Mitigation actions and recurring review schedules that feed the Reviews page.
Linking risks
Connecting a risk to controls, suppliers, incidents, assets, and vulnerabilities.
Open the register
- In the left sidebar, under Global, click Risks. You land on the cross-framework register at
/risks. - The page shows a sortable, filterable table of every risk you can see, with a Risk exposure matrix on the right.
- Click any row to open that risk's detail page.
There is also a per-framework view at Framework → Risks, which shows only the risks tied to that framework. It behaves the same way but is scoped to one framework.
The register is permission-scoped, not company-public. You see only the risks you hold risk:read on for their scope. A user with no applicable grant gets an empty page rather than an error. Because of this, two people can legitimately see different rows in the same register.
What you'll see as a member
The screenshots here are an admin's view. A non-admin's experience differs in a few ways:
- The Risks nav only appears if you have risks to see — i.e. you own risks, hold a risk-related role, or your frameworks contain linked risks. If none of that applies, the sidebar entry stays hidden.
- The register is scoped to you. Admins and company-wide readers see every risk; a framework-scoped user sees only the risks tied to their frameworks, and may land on an empty register.
- The New risk button is only shown if you can create risks — admins, framework editors/admins, and risk or control editors and owners. Read-only users (for example auditors) see the register but no New risk button.
Read the table
The table has these columns (toggle them with the Columns chooser):
| Column | What it shows |
|---|---|
| Risk | The title. Click to open the risk. |
| Level | The derived band: Low, Medium, or High (see scoring below). |
| Score | The computed exposure, 1-25. |
| I x L | The impact and likelihood that produced the score. |
| Owner | The accountable company member, or Unassigned. |
| Frameworks | Frameworks the risk is associated with. |
| Controls | Count of linked controls. |
| Status | The workflow status (Open, In Progress, Mitigated, etc.). |
| Next review | The next scheduled review date, if a recurring review is set. |
| Updated | Last-modified time. |
Use the search box and the Status, Level, Frameworks, and Owner filters to narrow the list, and click a column header to sort. The Status filter additionally includes AI Proposed for AI-generated draft risks (see Creating & re-scoring risks).
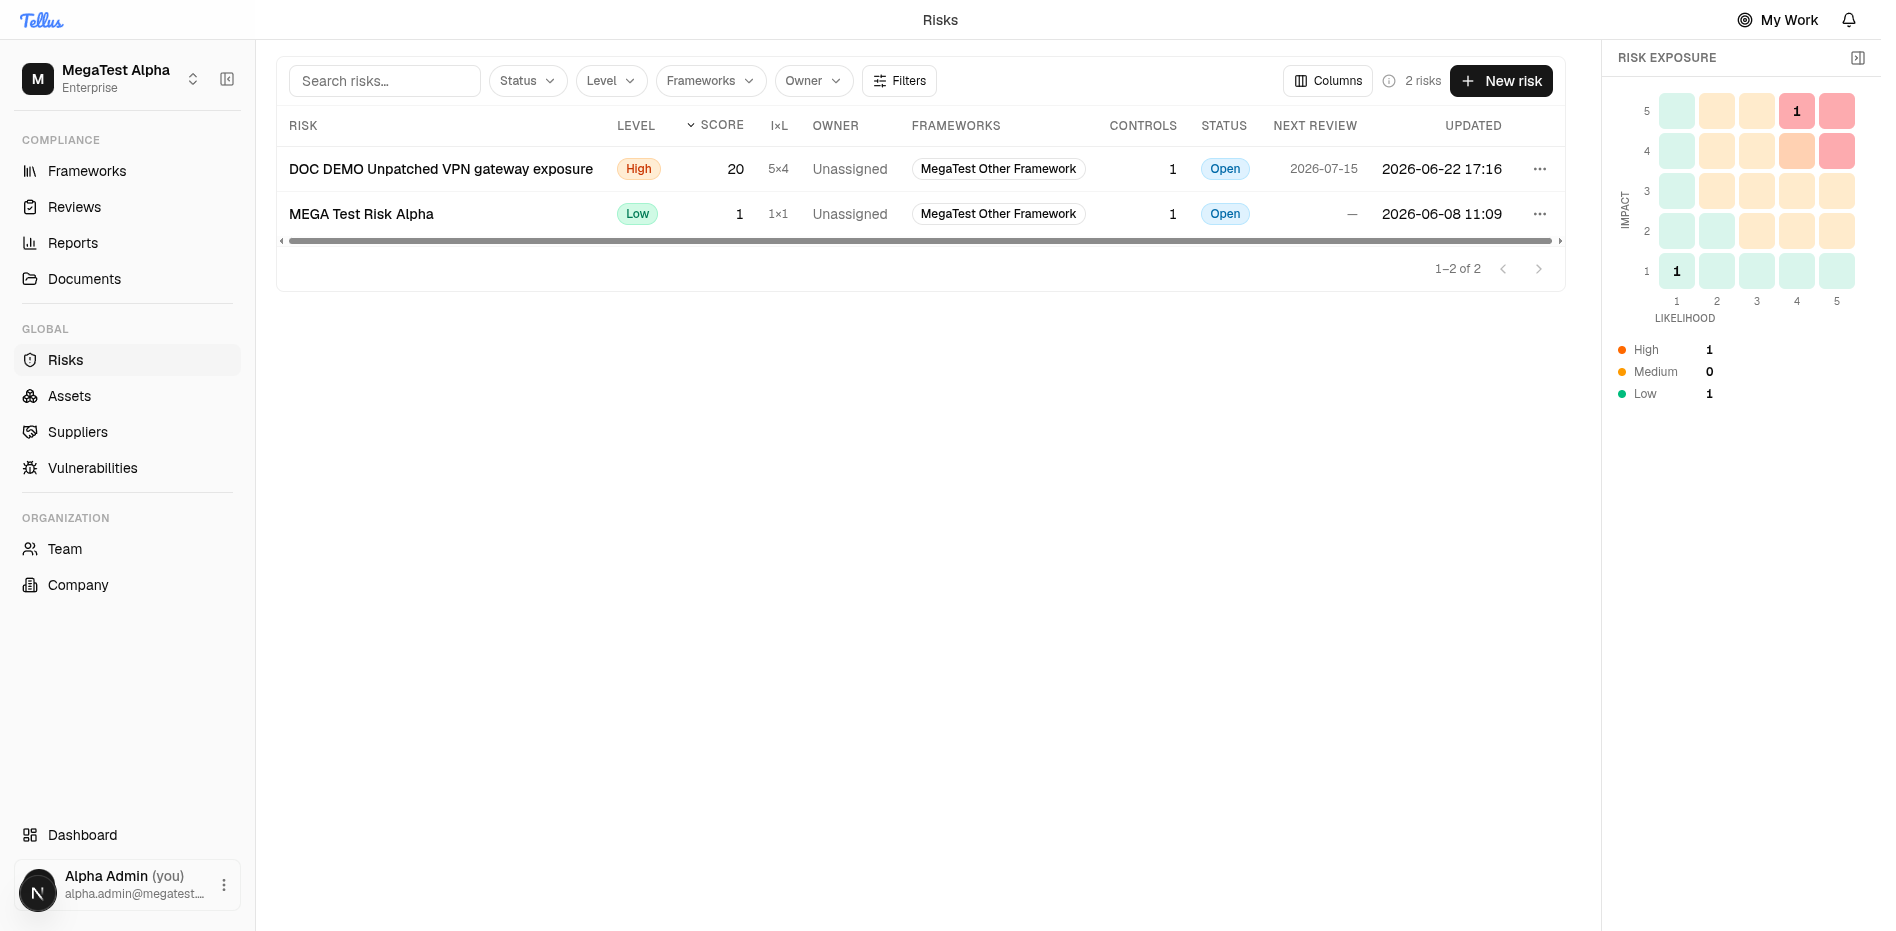
The exposure matrix
The Risk exposure panel on the right is a 5x5 heat-map of impact (one axis) against likelihood (the other), plotting your risks where they fall. A High / Medium / Low tally sits beneath it. The axes are labelled qualitatively (Very low to Very high for impact; Very unlikely to Very likely for likelihood) over the underlying 1-5 values.
Each cell is tinted by its score band, with one deliberate exception: the very hottest corner (score 20 or higher) is tinted red so the top-right reads as genuinely hot. This red tint is a visual cue only — those risks are still stored at level High, not a separate "Critical" level (see the note under scoring).
How scoring works
Every risk stores an Impact and a Likelihood, each entered on a 1-5 scale in the UI (Impact: Very low to Very high; Likelihood: Very unlikely to Very likely). The score is computed on the server as a plain product and recomputed on every create and update:
Risk score = Impact x LikelihoodThere is no weighting or rounding. With the standard 1-5 inputs the score ranges from 1 to 25.
The level is then derived from the score by a fixed set of thresholds:
| Score | Level | Badge tone |
|---|---|---|
| 1 – 5 | Low | green |
| 6 – 15 | Medium | amber |
| 16 – 25 | High | orange |
These bands are not equal thirds of 25. Medium spans 6-15 and High spans 16-25. A score of 6 is already Medium; a score of 16 is already High.
There is no stored 'Critical' level
The backend only ever stores Low, Medium, or High. "Critical" (red) exists only as a visual accent: the heat-map tints cells with a score of 20+ red, and the design system has a red "critical" colour. A risk's recorded level is never Critical — those hottest risks are stored as High.
The score and level update live as you change impact or likelihood, both in the new-risk form and on the evaluation grid. See Creating & re-scoring risks for how to set and change them.
Control roles
Assigning per-control roles, what Control Editor and Control Viewer each grant, the control_owner relation, and how framework access is derived.
Creating & re-scoring risks
The new-risk form and its defaults, plus re-scoring a risk on the 5x5 evaluation grid with its before/after confirmation.